
Let’s make sense of your data
At the INTERSECTION of data, design, and people, we turn messy spreadsheets into meaningful insights and visuals that help small businesses make better decisions, faster.

DATA Services

📈 Data Visualisation
I specialise in building beautiful, intuitive dashboards, mainly in Power BI. No more cluttered reports or confusing charts - just clear, interactive visuals that bring your data to life.

🔍 DATA ANALYSIS
Get to the why behind the numbers. I dig into your business data to uncover patterns, trends, and insights - so you can make confident, evidence based decisions.
🧹 Data Cleaning & Transformation
Before we can tell great stories with your data, we need it in shape. I clean, restructure, and refine your datasets - ensuring accuracy, consistency, and a solid foundation for analysis.
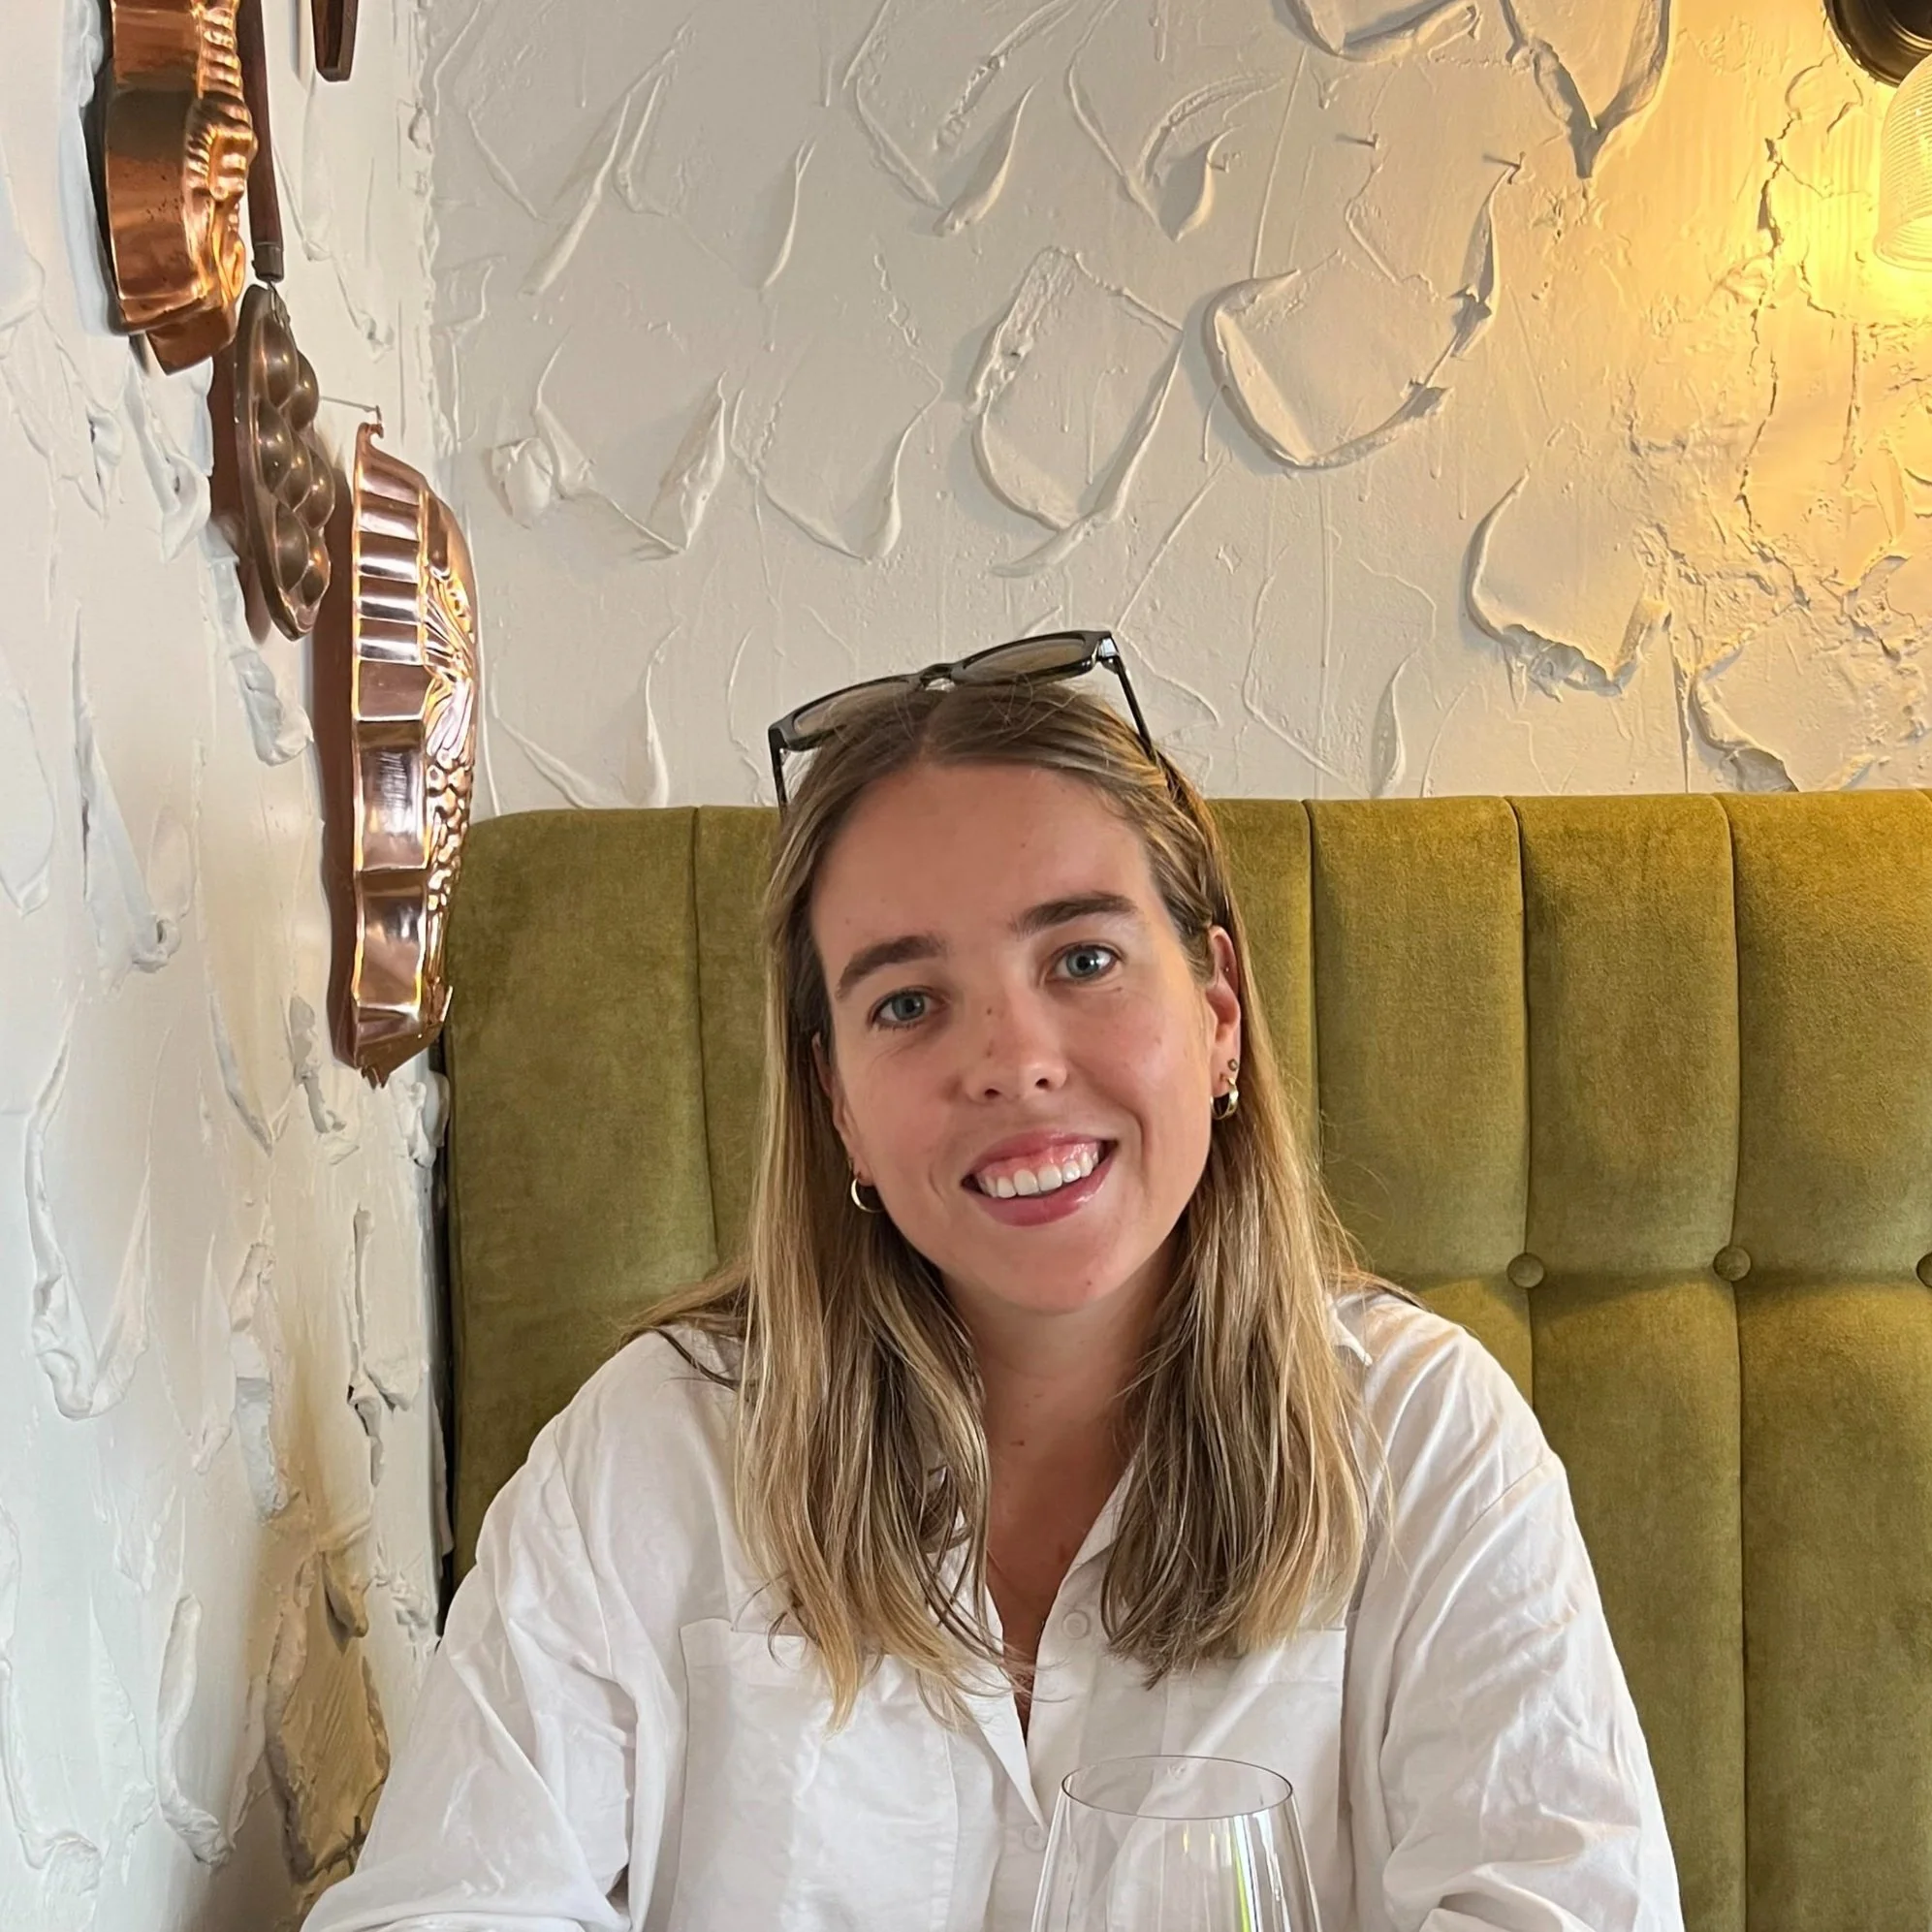
ABOUT ME
Hi, I’m Belle - the person behind Intersection. I’ve got a degree in statistics, and over the years I’ve worked at a big 4 firm, a data consultancy, and now a marketing agency. This has given me a deep (and practical) understanding of how data can help in making better decisions.
What really matters to me, though, is making data feel human. I don’t think numbers should be overwhelming - they should be clear, helpful, and maybe even a little exciting. I specialise in data visualisation because I love turning complex info into stories that actually make sense to people.
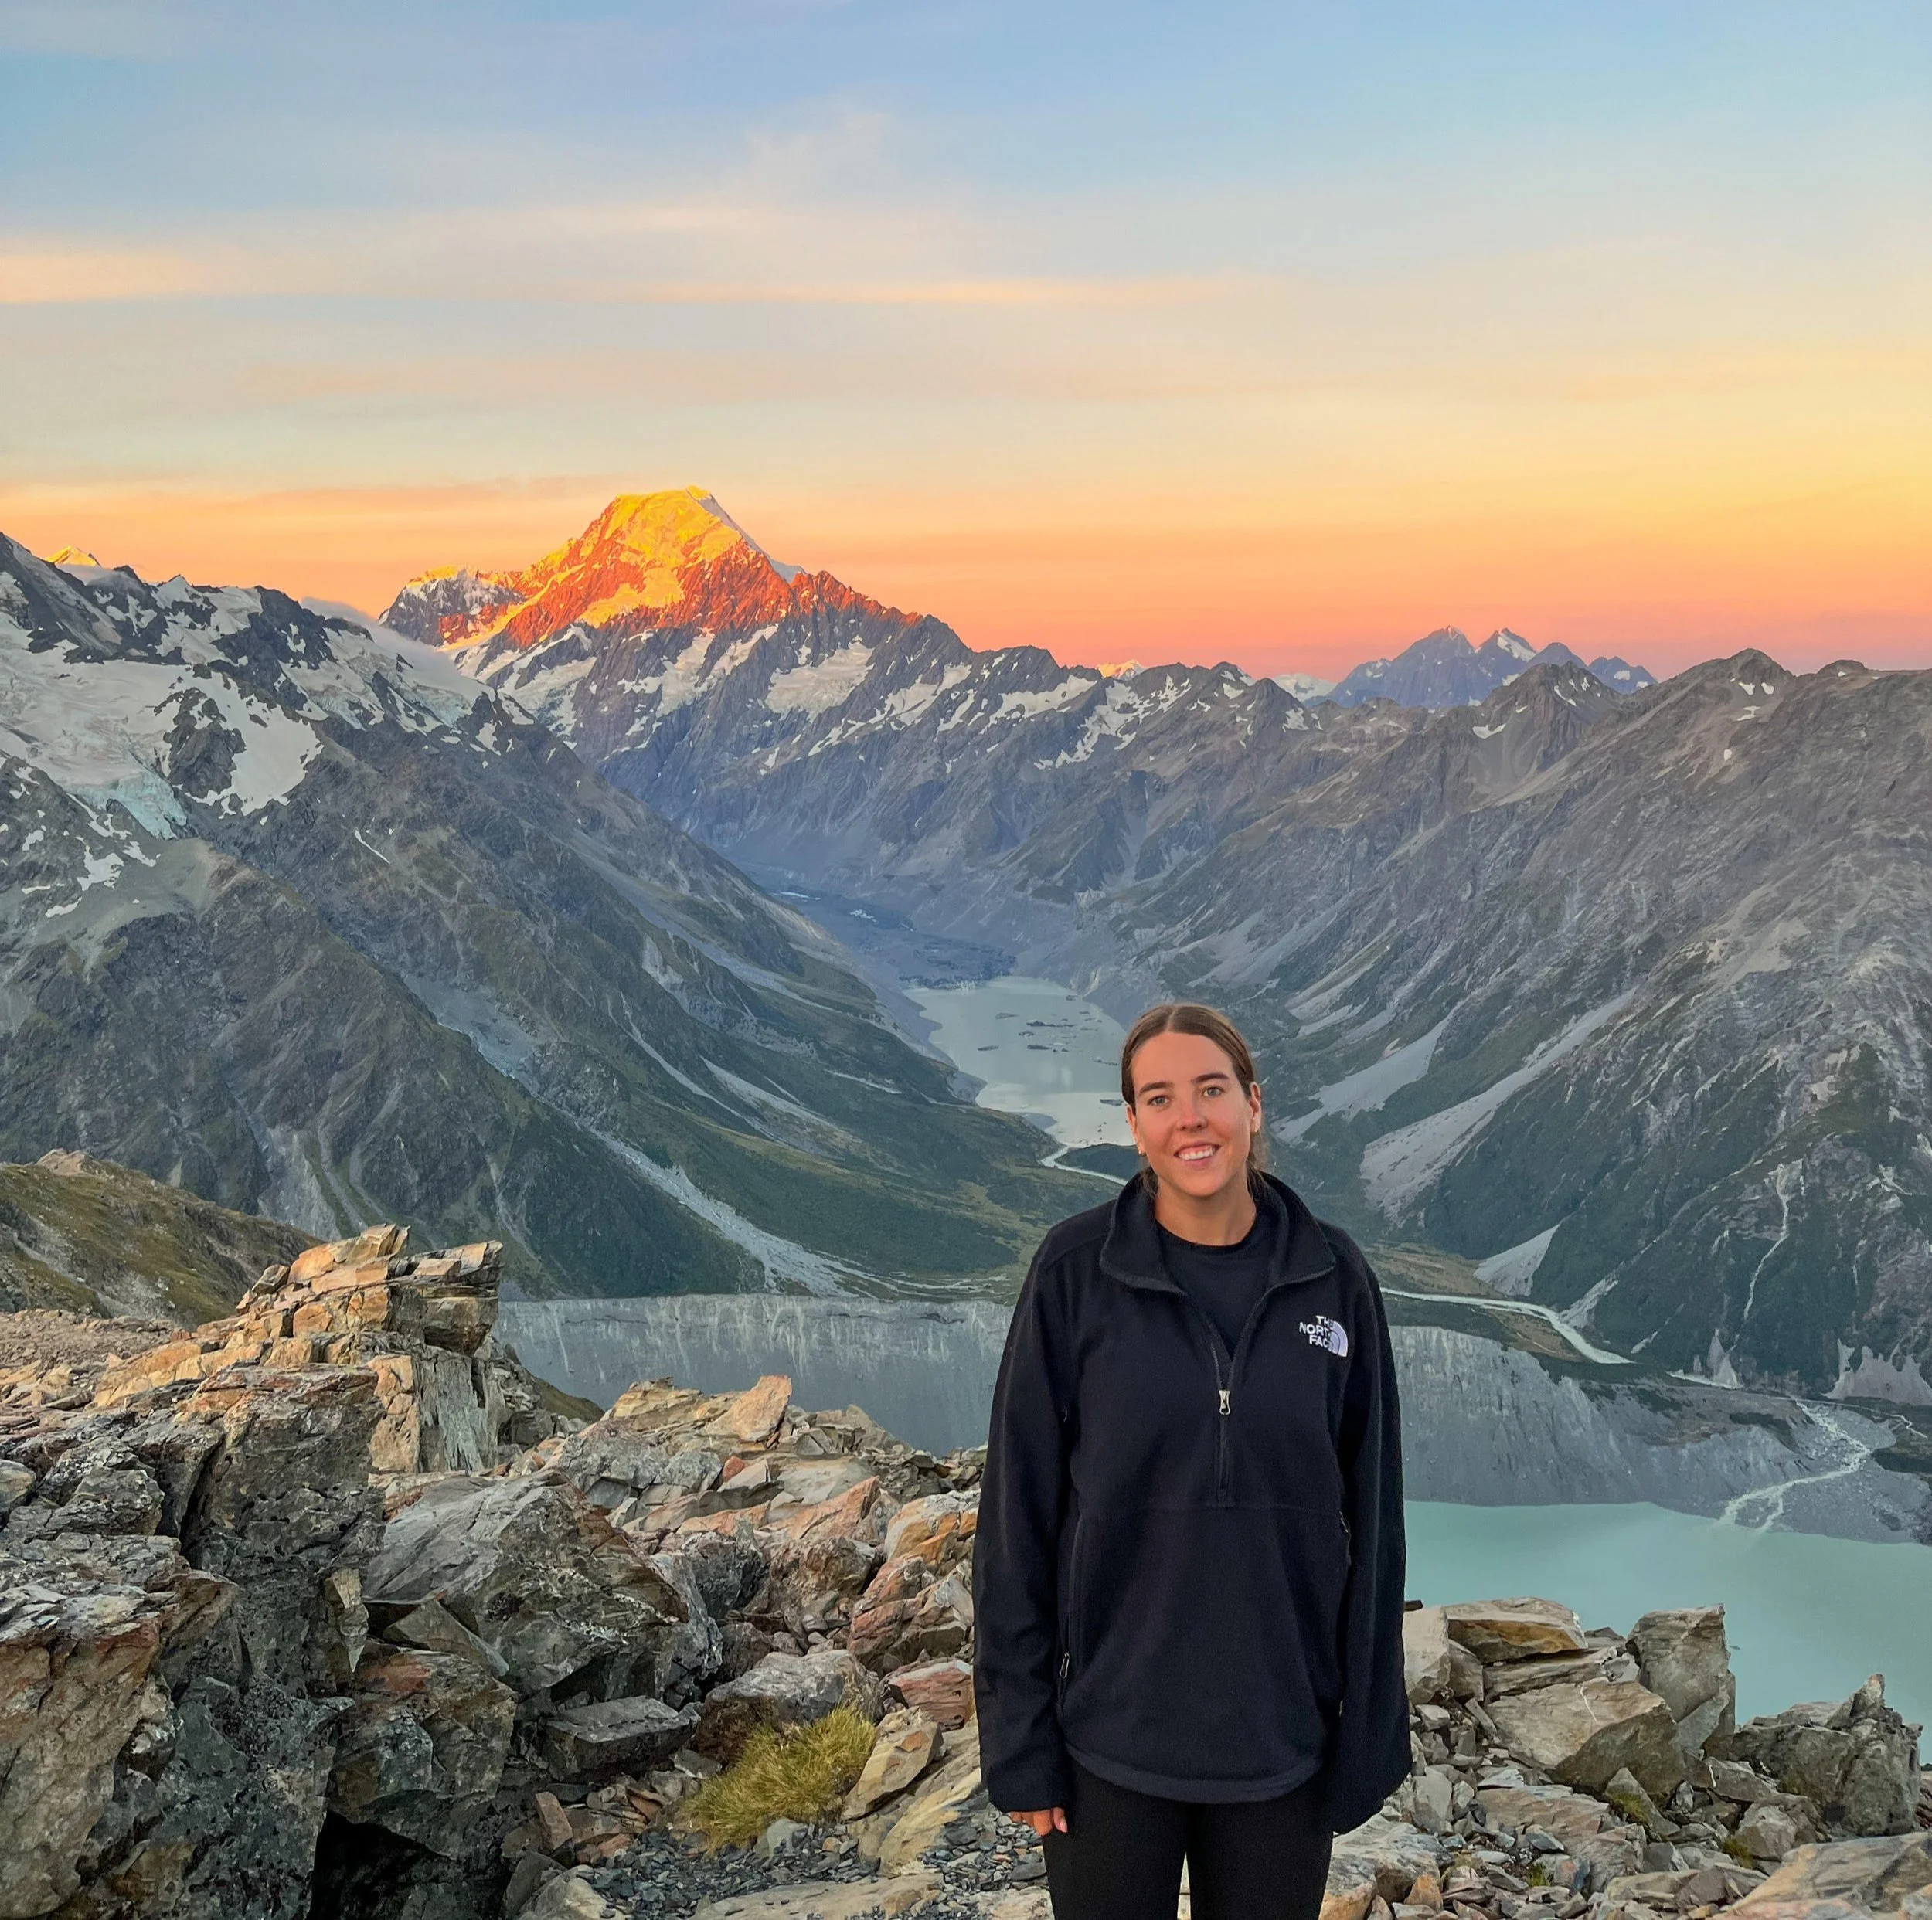
When I’m not working, you’ll find me outdoors or off exploring new places around the world.
Contact
Send through your details and I’ll be in touch. No pressure, just a friendly chat about where your data could take you.